Statistical Modeling Experimental Analysis of Cognitive Effects
Evaluate nicotine’s cognitive effects by employing statistical models in R. Retrieved data collection with 60 participants and developed a randomized complete block design (RCBD). Cleaned data and created tailored data visualizations comparing memory performance pre and post nicotine use. Utilized R for statistical modeling, including ANOVA, paired t-tests, and power calculations.
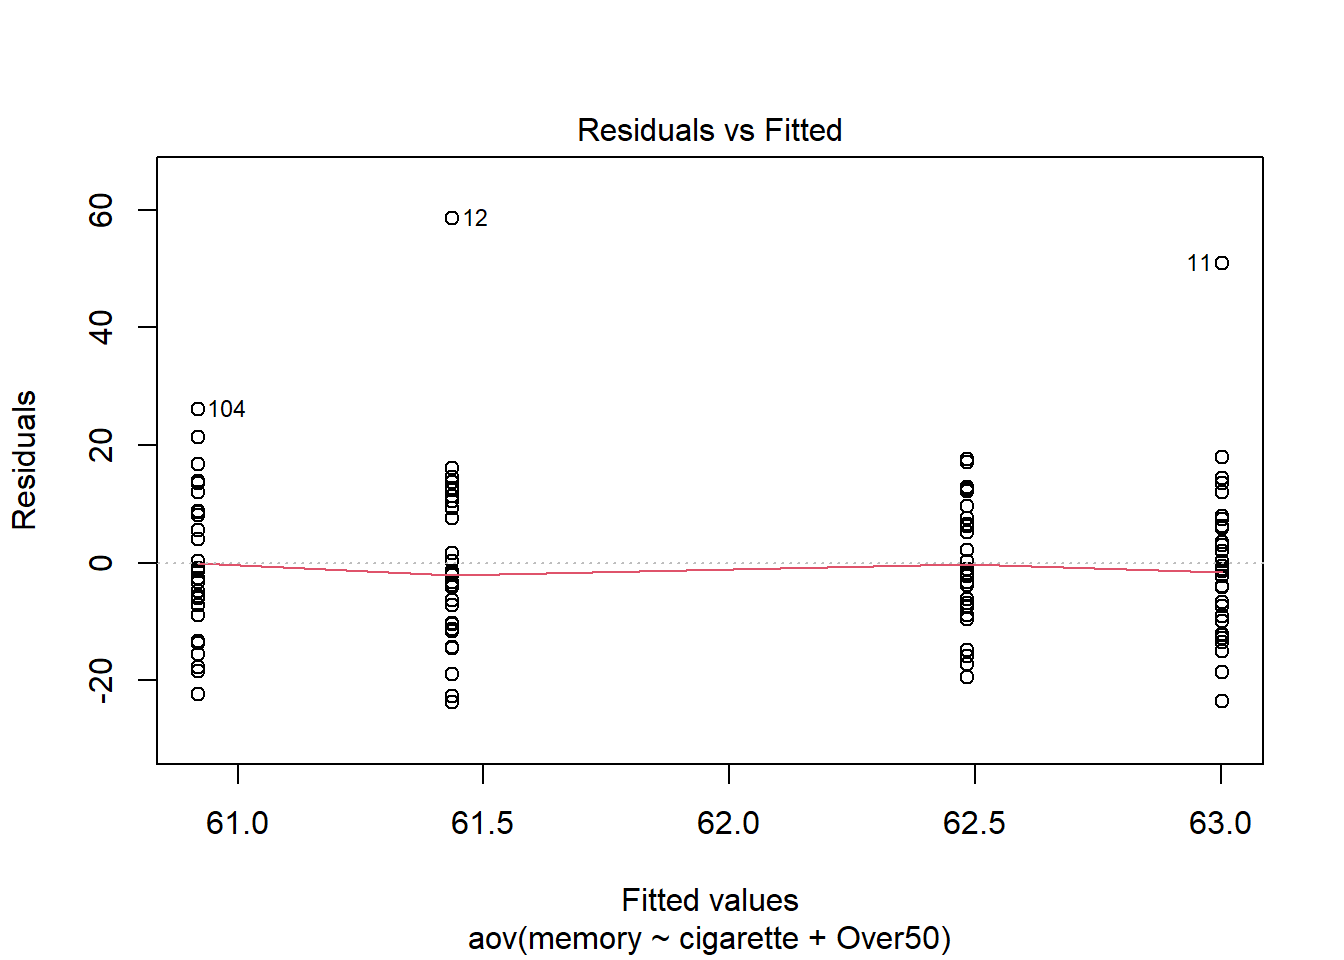
             Df Sum Sq Mean Sq F value Pr(>F)
cigarette     1     73   73.48   0.419  0.519
Over50        1      8    8.03   0.046  0.831
Residuals   117  20529  175.47
# Test with no blocksummary(aov(memory~cigarette,data=df2))
             Df Sum Sq Mean Sq F value Pr(>F)
cigarette     1     73   73.48   0.422  0.517
Residuals   118  20538  174.05
Power Calculations
library(pwr)
Warning: package 'pwr' was built under R version 4.4.3
d <-1.565f <- d/sqrt(73.48)pwr.anova.test(k=2, n=60, f=f ,sig.level=0.05)
     Balanced one-way analysis of variance power calculation

              k = 2
              n = 60
              f = 0.1825701
      sig.level = 0.05
          power = 0.5094948

NOTE: n is number in each group
Paired t-test with cigarette treatment, no blocks
var.test(df$NoCig, df$Cig)
    F test to compare two variances

data:  df$NoCig and df$Cig
F = 0.78012, num df = 59, denom df = 59, p-value = 0.3429
alternative hypothesis: true ratio of variances is not equal to 1
95 percent confidence interval:
 0.4659871 1.3060303
sample estimates:
ratio of variances
         0.7801239
t.test(df$NoCig,df$Cig, paired=T, var.equal=T)
    Paired t-test

data:  df$NoCig and df$Cig
t = 1.9963, df = 59, p-value = 0.05053
alternative hypothesis: true mean difference is not equal to 0
95 percent confidence interval:
 -0.003698997  3.133698997
sample estimates:
mean difference
          1.565